Data Viz
Interactive dashboards and data visualization that make complex institutional data readable at a glance, for enterprises, research institutes and newsrooms.
-
Crafting an interactive UX dashboard for CAF
UX and visual design of an interactive dashboard for CAF, turning complex institutional data into ten clear, brand-aligned visualizations.
-
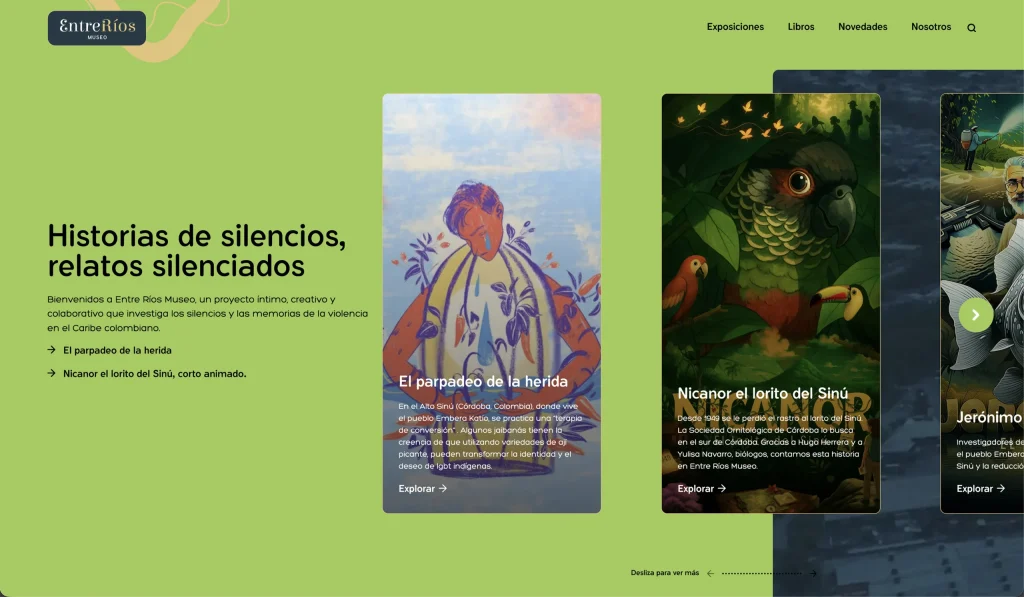
Shaping the architecture of memory: creative direction
Creative direction of Entre Ríos Museo’s exhibition on Caribbean violence and memory, with the Emberá Katío and Alto Sinú communities.
-
Making data human: environmental defenders in Latin America
Interface design for the Tierra de Resistentes database, turning records of environmental defenders across Latin America into something human.