Making data human: environmental defenders in Latin America
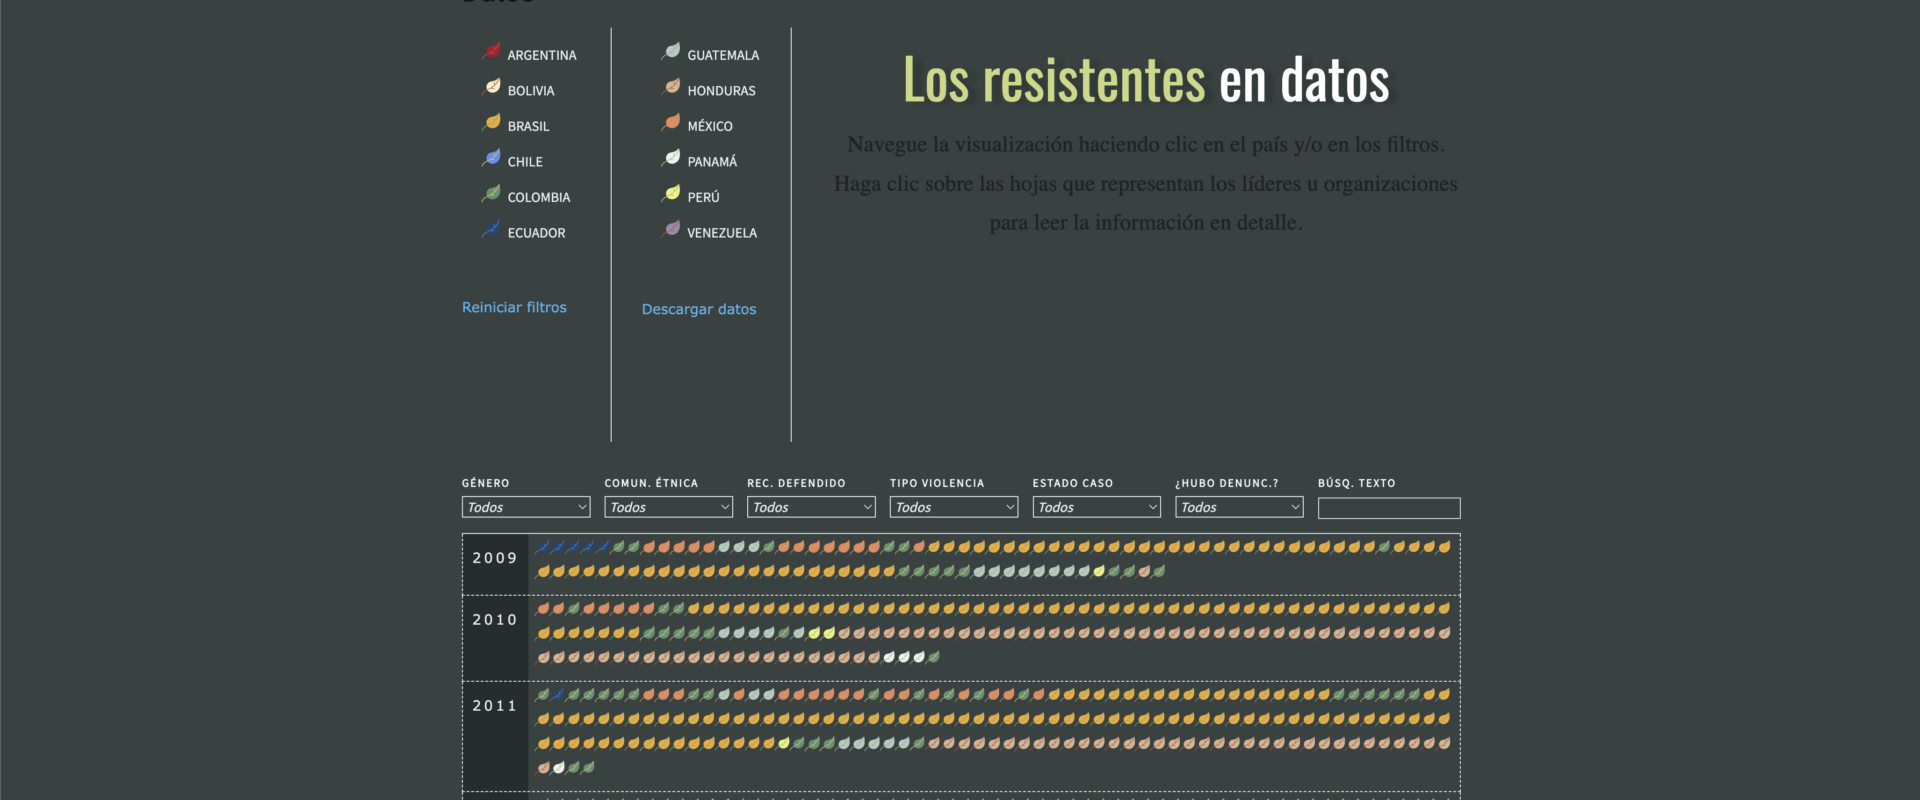
Designing the visual structure and interface for the Tierra de Resistentes database was an exercise in turning vast, heavy records of human struggle into something human and navigable. When you are mapping environmental and social defenders across multiple countries, data can easily become an overwhelming wall of numbers.
As the designer behind this interface, my goal was to build a fluid visual architecture where every filter, country breakdown, and timeline element feels intuitive and respectful of the stories behind them. Working on platforms like this reminds me that data visualization is never just about aesthetics, it is about clarity, empathy, and making vital information accessible so these stories of resistance can be truly understood and seen.
Result
Visual architecture and interface for the Tierra de Resistentes database, mapping environmental and social defenders across several countries with filters, country breakdowns and timeline.